
Reading your analytics
Analytics shows the shape of the business rather than answering a specific question. Set the period first — Today, This Week, This Month, This Year or a custom range — because everything follows it. Popular Services is the most actionable panel: it tells you what people actually come to you for. Revenue counts only bookings marked complete.
Where the Reports page answers specific questions — what did we take last month, who hasn't paid — Analytics gives you the shape of the business at a glance. It's under Reports, and it's available to administrators on a paid plan.
Pick a period first
The dropdown at the top offers Today, This Week, This Month, This Year and a Custom Range. Everything on the page follows it, so it's the first thing to set — a quiet-looking page is often just a period with nothing in it yet.
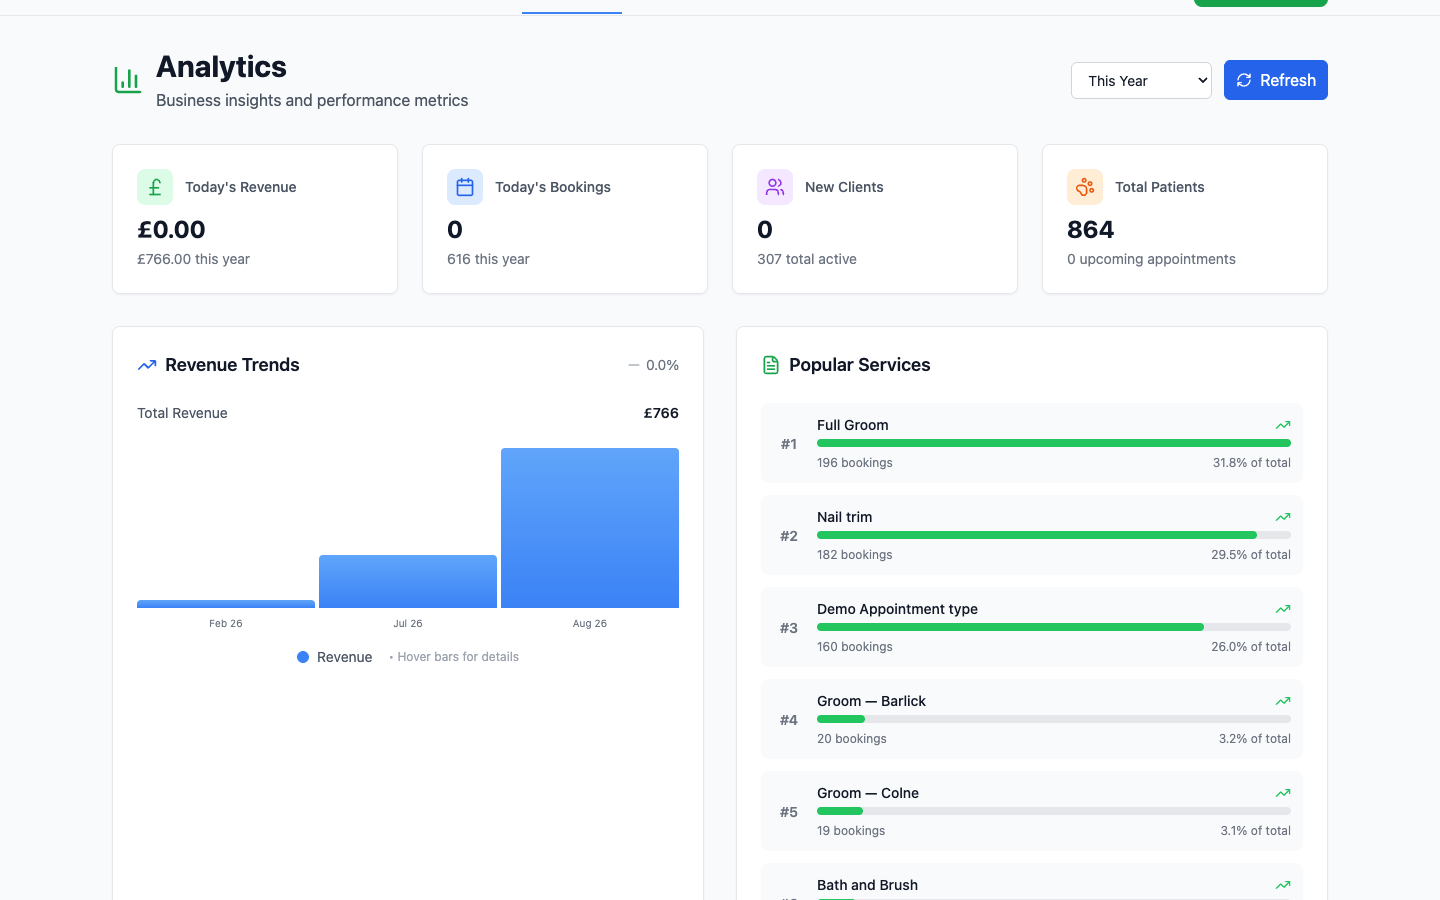
The four headline figures
- Today's Revenue — taken today, with the chosen period's total underneath.
- Today's Bookings — appointments today, with the period's count underneath.
- New Clients — customers added, against your total active.
- Total Patients — animals on your books, with upcoming appointments underneath.
The small green or red arrow next to a figure is the change against the previous comparable period. A red arrow on a Monday morning usually means it's Monday morning, not that anything is wrong — look at the trend over a month before drawing conclusions.
Revenue Trends
A bar per period with your total alongside. Hover a bar for the detail. This is the chart worth looking at monthly — it shows seasonality you'd never notice from the diary, and most practices have more of it than they expect.
Popular Services
Your services ranked by how often they were booked, with a count and a share of the total against each.
This is the most actionable panel on the page. It tells you what people actually come to you for — which is what your website should lead with, and what's worth staffing for. The service at the bottom of the list is worth a question: is it priced wrong, or just not something anyone wants?
Analytics counts completed work
Revenue here comes from bookings that have actually happened and been marked complete. A busy-looking diary with nothing marked off produces a flat chart — if the numbers look wrong, that's the first thing to check.